

This article was originally published in The Notebook. In August 2020, The Notebook became Chalkbeat Philadelphia.
A new report from the Education Law Center and Research for Action recommends a small but significant change in how Pennsylvania special education dollars are allocated that would mean millions more for Philadelphia and 160 other districts, many of which serve many low-income students and students of color.
The report comes as a state legislative commission is re-evaluating a formula for allocating special education dollars to districts – now about $1 billion annually – that was originally adopted five years ago.
The change involves tweaking the method used to determine a district’s wealth and tax effort. In 2016, two years after the adoption of the special education formula, a different legislative commission devised a formula for allocating basic education funding. That commission used updated metrics that more accurately reflected districts’ conditions and needs.
The report suggests using those updated metrics for the special education money as well.
The sticking point is that while 160 districts from throughout the state would gain funds if the recommendation were adopted, more than 300 would get less money. The report suggests phasing in the changes in a way that would minimize losses for those districts – or adding $150 million more to the overall allocation, which would guarantee that no district received less than the year before.
The legislative commission held public hearings in October and is expected to issue its report in November.
“There is no policy or research-based rationale for using different district characteristics in the special education formula when we have more accurate metrics already in use in the basic education formula,” said report co-author Reynelle Brown Staley, policy director at the Education Law Center (ELC). “Updating the district wealth factors would improve the accuracy of the formula in meeting the needs of students with disabilities and the districts that serve them.”
The main difference between the two sets of metrics, Staley said, is that the special education formula looks primarily at property taxes and property values, while the regular education formula looks at a broader range of factors to determine a district’s wealth and tax effort. For larger districts like Philadelphia, “property taxes account for just a small component of local revenue.”
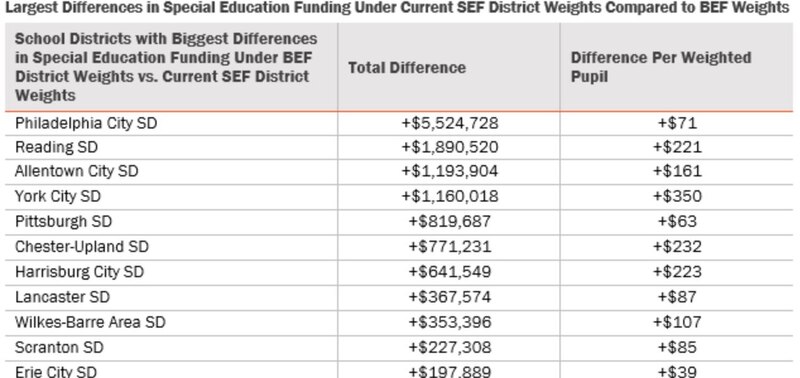
Source: Research for Action
If the recommendation were adopted, Philadelphia would receive an additional $5.5 million. Other financially strapped districts that would gain funds include Reading, York, Chester Upland, York, and Pittsburgh.
Although the change may seem simple and logical, it is just a small piece of a complex state education funding system, which is now facing a lawsuit over whether it’s equitable and adequate.
For instance, neither the regular education formula nor the special education formula is used to allocate most of the money that districts receive from the state. In both cases, only a small percentage is driven through the formula – just the increases in state education funding since the formulas were adopted. For special education, it’s about 14%, and for regular education aid, it is 11%, amounting to about $6 billion in total.
The reason for this: Although some districts would gain money – again, mostly those with more historically disadvantaged student groups, including Philadelphia – other districts would lose state aid.
When the state legislature formed the commissions to study how state aid was distributed, it specified that the issue of adequacy – whether the total pot was enough – was off the table.
Still, Anna Shaw-Amoah of Research for Action said, adopting this change would be significant.
“It’s really a common-sense step,” she said. “We think that changing the weights in the special education formula to something the state already approved would be a step in the right direction and would certainly help those districts that are really struggling to make ends meet to provide services that special education students need.”
Staley said that even though it is a relatively small amount of money, “It’s something they can do to help districts hurt by so little of the regular education money going through the formula. Generally, there is a lot of attention to the basic education formula as a source of inequity, and we think special education deserves similar attention because it is also operating in an inequitable way.”
Pennsylvania has some of the largest education funding disparities in the nation, with some wealthier districts spending up to three times as much as poorer ones. And it is in the bottom five in terms of the share of total education spending that the state funds.
For instance, while Indiana spends 17% more per student in its poorest districts, Pennsylvania spends on average about 35% less.
A major reason is that for most of the last three decades, it has lacked a formula that allocated funds to districts based on their overall enrollment and relative need. It is one of only three states that does not look at adequacy – or the amount that is actually needed – in deciding how much to allocate in education aid.
A full Costing Out Study was undertaken in 2008, assessing each district’s needs and laying out a formula for determining the necessary amount of state aid. Although the formula was adopted, it was not fully funded, and later was abandoned. The new regular education formula adopted in 2016 was applied only to new dollars. That was due to a “hold harmless” clause guaranteeing that no district would receive less than it had the year before, even if it lost population or its circumstances otherwise changed. Likewise, districts that gained students or saw increased poverty did not get additional state aid to compensate.
The Costing Out Study noted that in Pennsylvania, “school district spending is negatively associated with need and positively associated with wealth,” which is the opposite of what would be needed to improve outcomes for all students.
Not just the distribution, but the adequacy of the special education allocation is also at issue. An earlier report by ELC and PA Schools Work found that in 2008, state funding accounted for one-third of the money spent on providing special education services. Now it accounts for just 22%, putting more of the burden on local taxpayers. Restoring the state share to one-third would require $465 million more in state funding, the report concluded.