

This article was originally published in The Notebook. In August 2020, The Notebook became Chalkbeat Philadelphia.
A recent report from the U.S. Department of Education concludes that poorer school districts in Pennsylvania receive higher average revenue than wealthier ones. According to the report, districts in the poorest quartile have 18 percent more funding per student than those in the wealthiest quartile.
This conclusion conflicts with what several experts on school funding say.
Mark Price, a labor economist at the liberal-leaning Keystone Research Center, found that per-pupil spending is about 11 percent lower in Pennsylvania’s poorest districts.
Attorneys at the Public Interest Law Center are now pursuing a lawsuit against the state of Pennsylvania on the grounds of inadequate and inequitable distribution of education funding.
But even if the U.S. Department of Education data accurately represent Pennsylvania’s school funding compared to other states, it does not mean that poorer districts have enough resources to offer the same quality of education as wealthier districts.
Data consultant David Mosenkis said that low-income students in high-poverty districts face “concentrated poverty,” which is “associated with higher costs of education, such as absenteeism and disciplinary problems.”
Mosenkis also questions whether the higher per-pupil revenue – the result of state and federal aid meant to offset wide differences in local wealth and taxing capacity – is sufficient to overcome the higher costs faced by poorer districts.
“The data is showing that the poorest quartile is getting slightly higher funding, but this does not imply that they are getting more educational resources, because we don’t know if it’s enough to compensate for the higher costs they incur,” he said.
Mosenkis’ own research, conducted on behalf of POWER, a Philadelphia interfaith organization, indicated that predominantly non-white districts receive less than their fair share of state funding, unlike the whitest districts, which receive more than their fair share. He found this to be true even after controlling for poverty level.
Both sets of school funding data – from the U.S. Department of Education (USED) and the Keystone Research Center – account for federal, state, and local revenue sources. The Keystone Research Center used information from the Pennsylvania Department of Education to compile its data. The data are replicated in the charts below.
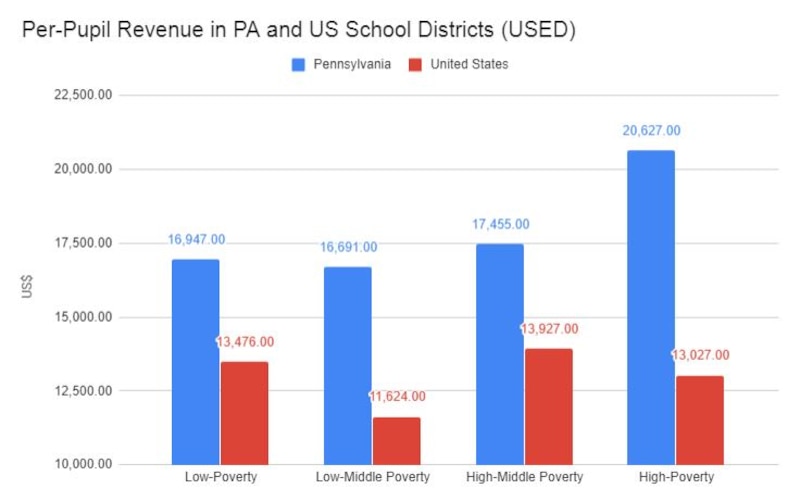
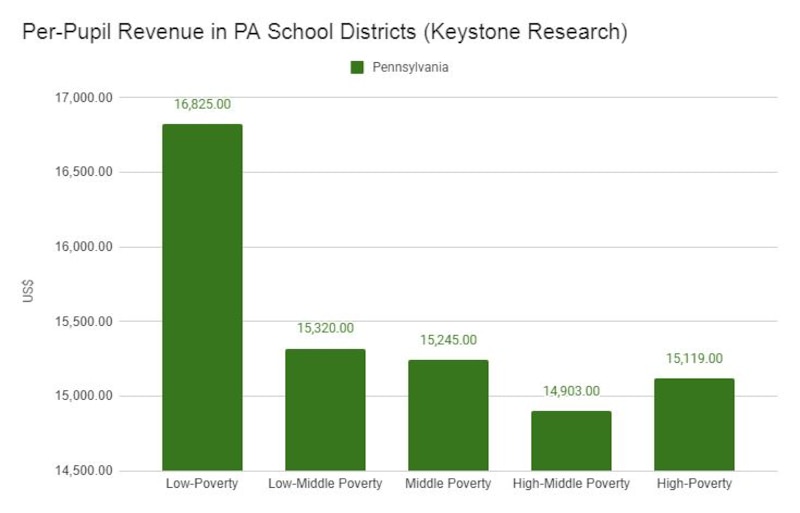
In the top chart, data from the U.S. Department of Education, fiscal year 2015, were used. For the bottom chart, data were provided by the Keystone Research Center, fiscal year 2014-15.
Footnotes in the federal Education Department’s report state that 1.8 million students nationwide were excluded because their local education agencies did not report sufficient financial or student poverty data to federal agencies. Among those excluded, 1.5 million were from charter schools.
“Conceivably, [the exclusion] could have some impact on the [USED] data,” said Stephen Cornman, project director at the U.S. Education Department and one of the report’s authors.
The federal report used data from the Small Area Income and Poverty Estimates (SAIPE) program of the U.S. Census Bureau, which estimates poverty levels across states, counties, and school districts.
“We’re kind of constricted and our hands are tied because the SAIPE poverty data does not include students in charter schools,” Cornman said.
Marguerite Roza, a research professor and director of the Edunomics Lab at Georgetown University, suggested that different results could emerge based on how the school districts are categorized.
“It depends on how you cut the districts. If you look at the top half vs. the bottom half, you might get one number. If you look at the top quartile vs. the bottom quartile, you could get a different number,” she said. “… You’re looking at a different set of districts each time.”
After using the federal Department of Education’s method to compare school districts, Michael Churchill of the Public Interest Law Center said, he still could not produce the same numbers.
“I couldn’t replicate the results. It seems contrary to the information that we have when we run these numbers,” he said.
Churchill also questioned the criteria that the department used to divide school districts into quartiles by poverty level.
The Education Department’s report states that “each quartile contains approximately the same number of children ages 5–17 in families living below the poverty level.” That resulted in the anomaly of just 25 districts comprising Pennsylvania’s high-poverty quartile because it included Philadelphia, which is more than five times larger than Pittsburgh, the next-largest school district. In total, the state has 500 districts.
“They defined the quartiles in a very strange way,” Churchill said. “There are only 25 districts that have children in the [high-poverty] quartile because Philadelphia is 25th and runs it way over the [enrollment] number. There are 200-and-something districts in the lowest poverty group because there are so few [low-income] students” in each district.
Cornman said that defining the quartiles by students in poverty produced more reasonable results in most states than using the more conventional method, which defines the quartiles by total student enrollment so that each quartile has an equal number of students, whether low-income or not.
Cornman described how the conventional method led to districts being classified as high-poverty even if their poverty rates are not necessarily high. In Maryland, “if 12 percent of [a school district] were in poverty, they’d be placed into the highest poverty quartile and I thought that [12 percent figure] was very, very low,” he said.
Previous U.S. Education Department data from 2011-12 used the conventional method, comparing per-pupil expenditures across poverty quartiles defined by total student enrollment. That analysis showed the opposite trend: Pennsylvania spent 11.7 percent less on each student in high-poverty districts than low-poverty districts. About one million students from charter schools were excluded from that analysis.
Under the federal department’s current method, districts grouped in Pennsylvania’s high-poverty quartile have more than 36 percent of their students living in poverty. Those in the low-poverty quartile have less than 14 percent.
When asked whether this analytical method is relatively new, Cornman said yes, and added that “frankly, it should not make that much of a difference.”
For school districts in Pennsylvania and across the country, federal funding is the smallest revenue source compared to state and local shares of revenue. Almost half of the Philadelphia School District’s revenue comes from state funding, followed by local and federal funding.
Data from the U.S. Department of Education, fiscal years 2014 and 2015
Statewide, 34 percent of school funding comes from Harrisburg and about 60 percent from local sources, with half of the remaining amount supplied by the federal government. Pennsylvania’s portion is among the lowest for U.S. states – nationally, the average state contribution to school funding is 48 percent. This means that most of the burden falls on local taxpayers in Pennsylvania.
Data from the Pennsylvania Department of Education, 2014-15
Federal funding usually takes the form of program subsidies, such as those for Title I to support children from low-income or other vulnerable backgrounds, as well as child nutrition grants.
Cornman said that the federal data would not be used for allocating federal funding, but was meant to enhance public knowledge.
“We know, overall, there’s a significant demand for school finance data,” he said. “This school finance data can be utilized to investigate whether resources vary within or across school districts, according to different school characteristics.”
Local funding remains largely dependent on property taxes, which disadvantages low-income school districts that cannot raise as much tax revenue from property wealth. On the state level, property taxes make up 45 percent of total school district revenue, but the national figure is 30 percent. This shows that Pennsylvania relies on local property tax far more than most states do.
Roza said that state funding is meant to offset local disparities.
“There’s a rationale to making sure you have some local money in your funding formula because it adds additional cash, and then the state money can do the job of leveling across districts,” she said.
This does not happen in Pennsylvania, however, where the state share compared to the local share of education spending has been steadily dropping in recent years.
Over the next school year, the state plans to put more money into public K-12 education. Gov. Wolf’s proposed 2018-19 budget contains a 1.7 percent increase for basic education and 1.3 percent increase for special education, amounting to a total increase of $115 million.
But even with those increases, the state’s contribution to school expenses is lower in Pennsylvania than in most other states. Research from the National Education Association ranks Pennsylvania 46th out of 50 states in its share of total public school revenue.
“I certainly applaud the governor’s proposals to dispense additional resources, but we still have a long way to go in giving school districts the resources they need,” said Price from the Keystone Research Center.
Price said that most of the increases in state funding are spent on pension payments, rather than classroom activities that directly affect students.
“Over time, even as we’ve been increasing funding through state subsidies for basic education, districts have been facing increases in their own expenditures for pensions that have crowded out those increases,” he said.
Likewise, Churchill believes more state funding is necessary, especially for struggling districts.
“Just to bring districts that are spending below the median of actual instructional expenses up to the median and comply with the state formula on how you distribute funding, you need $3.2 billion [in additional state funds],” he said.
Churchill identified three problems with current school funding – inequitable property tax rates, over-reliance on local revenue, and insufficient money for meeting student needs.
“We need to deal with all three of the problems, not just with any one of them at a time,” he said.
Cornman, however, sees significant improvement in Pennsylvania’s distribution of school funding over the last few years.
“There are more resources going to high-poverty students in Pennsylvania. I can say that definitively,” he said.