

This article was originally published in The Notebook. In August 2020, The Notebook became Chalkbeat Philadelphia.
Based on PSSA scores for 3rd graders
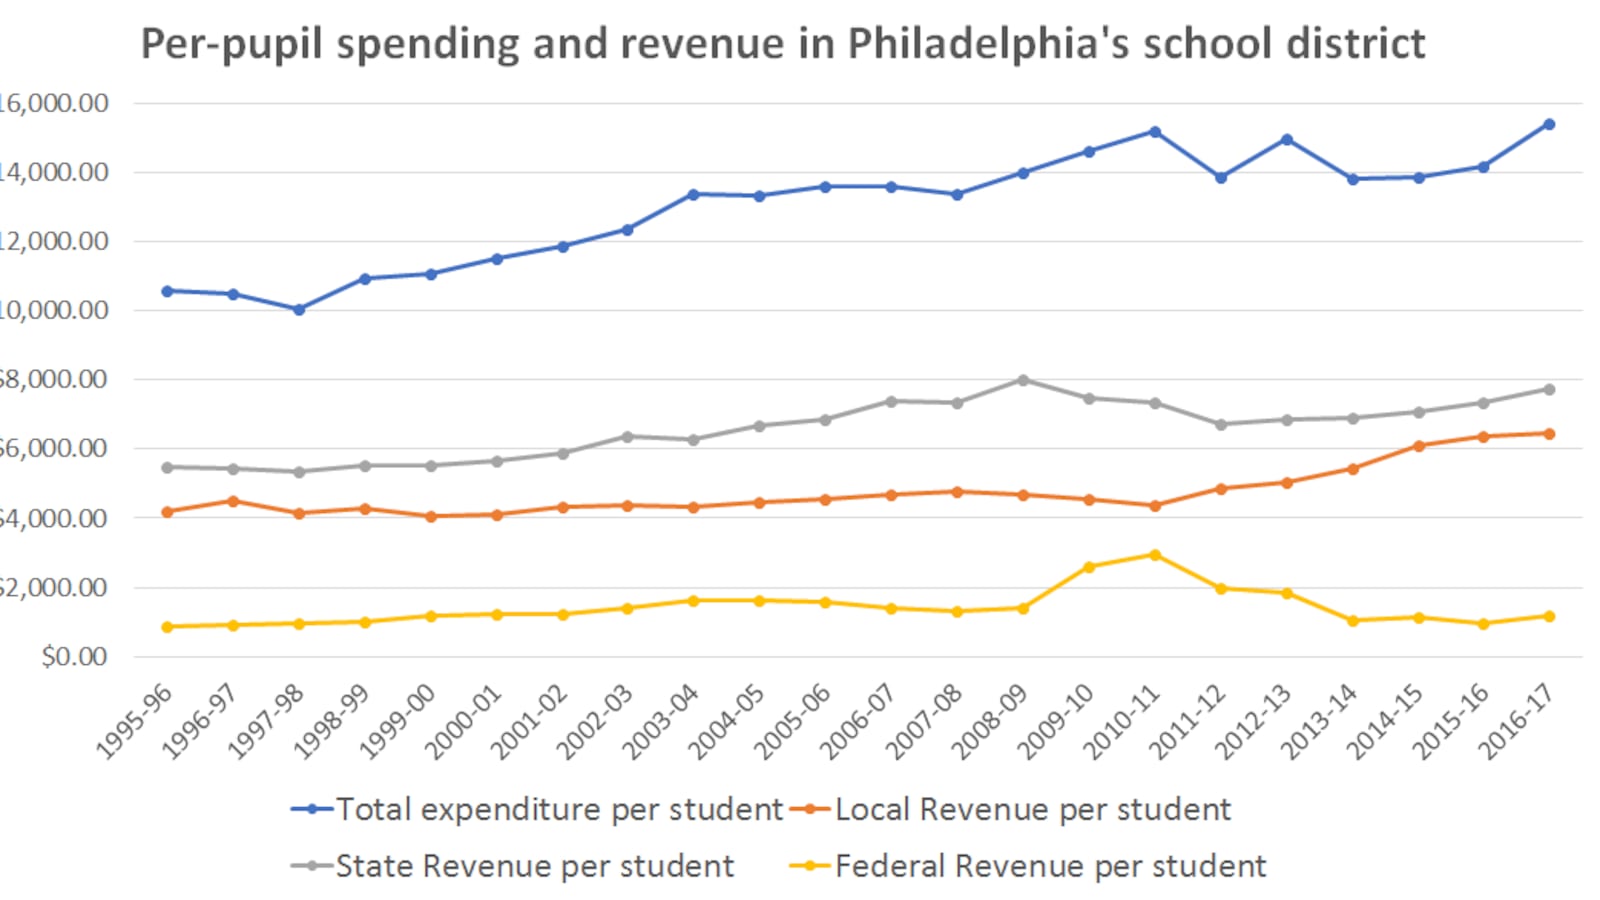
Had brief peak in 2011, severe budget cuts started in 2012
Source: PA Open Data, School District of Philadelphia
State budget cuts took effect starting in 2012.
Sources for 5th, 8th, & 11th grades:
Philadelphia School Report Card 2006 for years 2001-2005.
SDP’s No Child Left Behind Report Card 2003-2004 confirms years 2002-2004.
Open PA Gov confirmed other sources’ and provided data for years 2006-2008.
Philadelphia School District Performance Office for years 2009-2017.
Was rising rapidly before test change in 2011, now has dropped.
Sources for 5th, 8th, & 11th grades:
Philadelphia School Report Card 2006 for years 2001-2005.
SDP’s No Child Left Behind Report Card 2003-2004 confirms years 2002-2004.
Open PA Gov confirmed other sources’ and provided data for years 2006-2008.
Philadelphia School District Performance Office for years 2009-2017.
Mild rise before change in 2011, massive drop after change.
Sources for 5th, 8th, & 11th grades:
Philadelphia School Report Card 2006 for years 2001-2005.
SDP’s No Child Left Behind Report Card 2003-2004 confirms years 2002-2004.
Open PA Gov confirmed other sources’ and provided data for years 2006-2008.
Philadelphia School District Performance Office for years 2009-2017.
Little change from 2001-2017
Sources for 5th, 8th, & 11th grades:
Philadelphia School Report Card 2006 for years 2001-2005.
SDP’s No Child Left Behind Report Card 2003-2004 confirms years 2002-2004.
Open PA Gov confirmed other sources’ and provided data for years 2006-2008.
Philadelphia School District Performance Office for years 2009-2017.
Mild rise before 2014 before dropping dramatically, slowly increasing again.
Sources for 5th, 8th, & 11th grades:
Philadelphia School Report Card 2006 for years 2001-2005.
SDP’s No Child Left Behind Report Card 2003-2004 confirms years 2002-2004.
Open PA Gov confirmed other sources’ and provided data for years 2006-2008.
Philadelphia School District Performance Office for years 2009-2017.
4 year cohort
Decreased until 2004, it’s been on an upward trajectory since.
Source: Project U-Turn A Promise Worth Keeping for years 2000-2009.
The Notebook’s article “Graduation rate flat after years of increases” for years 2009-2011.
School District of Philadelphia Scorecard SY 2016-2017 for years 2012-2017.
Pennsylvania Department of Education confirmed years 2010-2017.
Low point in 2010, stayed more or less the same.
Source: National Center for Education Statistics.
Public school enrollment decreasing while charters are growing.
Source: School District of Philadelphia financial report
Philadelphia – risen, in step with state
Pennsylvania – risen, similar to city
Sources: State data provided by the National Education Association’s Rankings of States and Estimates of School Statistics.
Philadelphia data provided by National Center for Education Statistics.
Stayed similar until 2010, when a massive decline occurred.
Source: National Center for Education Statistics.
Upward trajectory with peak in 2011.
Sources: Philadelphia Safe and Sound Report Card 2005 for years 2000 to 2005.
The Philadelphia Inquirer Report Card on the Schools for years 2006 to 2009.
Provided by Pennsylvania Department of Education via email for years 2010 to 2017.
Alternative schools are about 60% while public and charter fall just below the 50% line.
This includes only 2017 graduates, not older students.
Source: CCP
All schools have over 50% of students enrolled in developmental math courses.
Alternative schools have over 80%.
This includes only 2017 graduates going directly to CCP, not older students.
Source: CCP
Public and charter are around 30% and alternative is as high as 40%.
This includes only 2017 graduates going directly to CCP, not older students.
Source: CCP